


{{ w.title }}
- {{ p }}
Platform · Channels
An account-wide buy-box rate cannot tell you which retailer is underperforming. Channels reports every metric per retailer, in that market's currency, so a commercial review opens with that retailer's own numbers.
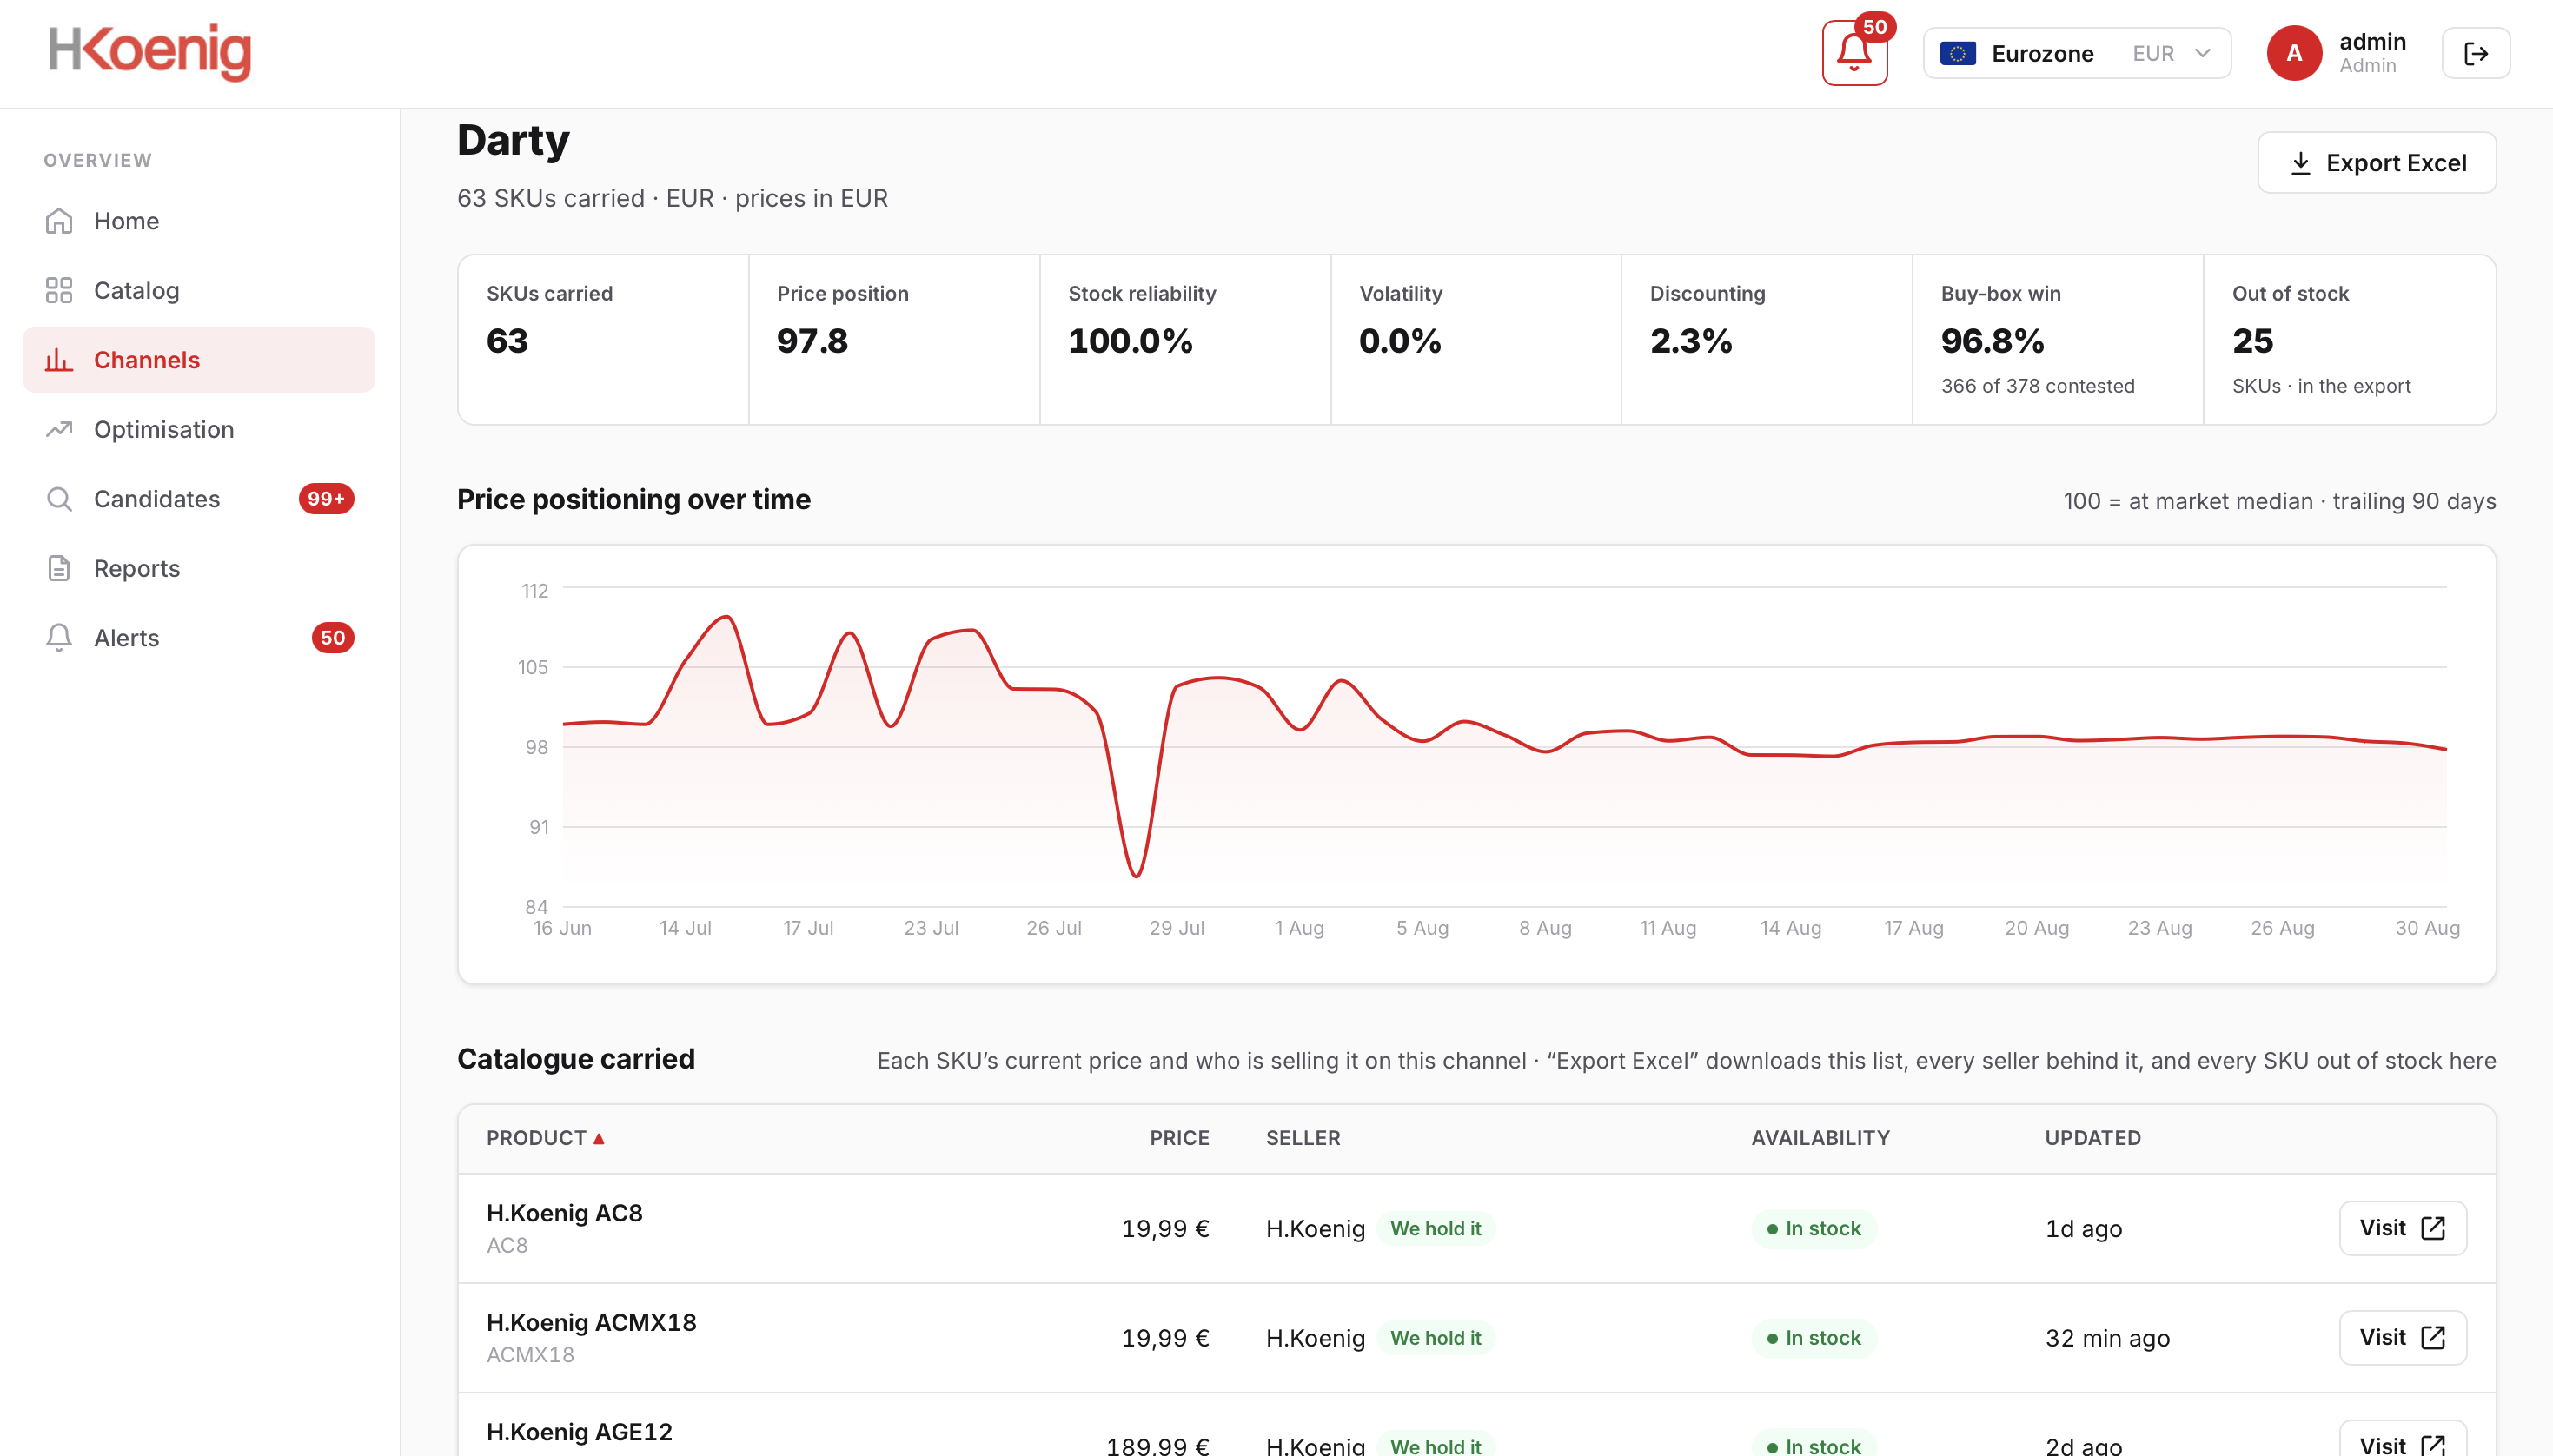
Platform shown through a client account, with permission, for data demonstration purposes.
What is on it
Region and currency are selected at the top. Seven metrics follow, then a 90-day price-position trend, then every product that retailer carries: price, the seller holding the buy box, whether that seller is you, availability, and the time of the last capture. The screen is scoped to one retailer throughout, so nothing on it is diluted by performance elsewhere in the account. Switching retailer replaces every figure rather than adding a filter.
One retailer, one cycle
Figures from one client's Darty channel, taken from the July monitoring cycle. Every retailer in the account reports the same set.
63
products carried
Of the client's full catalogue
96.8%
buy-box win rate
Contested listings held on this retailer
97.8
price position
Indexed against the market median of 100
100%
stock reliability
Products kept orderable across the cycle
25
products out of stock
Listed but not orderable at capture
2.3%
discounting
Average distance below reference price
Platform shown through a client account, with permission, for data demonstration purposes.
The seven metrics
Each is calculated on that retailer's own catalogue rather than inherited from the account average.
How many of your products this retailer stocks, which is the denominator for every other metric on the screen.
Carried and orderable are separate counts, and both are shown.
This retailer indexed against the market median across the products it carries, where 100 is the median.
Below 100 means this retailer sells your products under the wider market.
The proportion of contested listings you hold on this retailer, shown with the underlying counts.
Expressed as held of contested, so a perfect rate on two listings cannot read as strength.
How consistently this retailer keeps your products orderable across the cycle.
A retailer that lapses monthly loses buy boxes without ever contesting them.
How far this retailer's listed prices sit below your reference price, across the catalogue it carries.
Reported as observed fact. What may lawfully be done about it varies by market.
How much price moves between scans on this retailer, and when each page was last read.
High volatility usually indicates automated repricing on the listing.
Fields and columns
Below the metrics, every product this retailer carries, in the currency selected.
| Column | Contents | Purpose |
|---|---|---|
| Product | The SKU this retailer stocks | Your catalogue on their listing |
| Listed price | What a customer pays here | In the selected region's currency |
| Buy-box seller | The seller winning the sale | Marked when the seller is you |
| Availability | Orderable, or listed and unavailable | Two different corrective actions |
| Competing offers | How many sellers are on the listing | A count of one indicates control |
| Last captured | Timestamp of the reading | Every figure carries a date |
Region and currency are display settings rather than separate accounts. One product read in two markets shows two prices against a single reference price, so a cross-border gap is visible without reconciling two reports by hand.
Why per-retailer reporting
Measured individually, the spread between retailers is immediately visible: strong and weak performers average into a figure that describes neither. Each bar divides one retailer into products you hold, products another seller holds, and products it does not carry — the distinction a single win-rate percentage removes.
Proportions shown are illustrative of the reporting structure rather than one client's figures.
Chart: per-retailer coverage, each shelf split into references held, contested and absent.
In practice
Arrive with that retailer's own win rate, price position and out-of-stock count rather than a blended figure.
One retailer at 30 on price position beside another at 98 is a supply question about where discounted stock is going.
Recovering a buy box on a retailer that cannot hold stock is work that reverses itself the following month.
One retailer's buy boxes, the competing offers behind them, and every out-of-stock product, as one workbook.
Platform shown through a client account, with permission, for data demonstration purposes.
Related
Seven screens, one daily scan underneath all of them.
The problem
Right now, a seller you never appointed a reseller with your stock a marketplace trader an account you cannot name somebody undercutting you is costing you revenue and losing you customers.
They win the sale on a listing you built, to a customer who believes they bought from you. If that order arrives late, damaged or grey-market, you lose a customer and the revenue both — and neither ever appeared in your channel to begin with.
Undercutting is only the visible half. The rest of the damage never announces itself.
And it is never just one thing
A lost buy box is the one you can see. Merqi reads all seven on the same scan, so the damage you have not noticed shows up beside the damage you have.
Why one row matters
The featured offer is not a ranking, it is the default. The other sellers sit behind a link most shoppers never open, and on mobile they are not on screen at all. So when someone else holds the box on your listing, the page still converts — for them, on your product, at a price you did not set.
What a lost box actually costsThe size of the prize
10–30%+
revenue our clients can recover
Every buy box lost to an unauthorised seller is a sale made at a price you did not set, on a listing you paid to build. Recovering those listings, closing the coverage gaps and holding distributors to their terms is where the range above comes from.
See what one scan cycle foundIndicative range. What Merqi recovers for your catalogue depends on how many of your listings are contested and how far price has drifted — the first report tells you which.
How it works
Every finding starts as a row in the same scan. What changes is the question you bring to it.
Platform shown through the H.Koenig account, with H.Koenig's permission, for data demonstration purposes.
What you get
The first two are what most brands come for. The rest is what they did not know they were missing — and the platform they read it all in.
See everything the platform reads{{ c.body }}
{{ c.detail }}
{{ c.body }}
{{ c.detail }}
On one client account, Merqi reads 4,196 listings across 78 active retailers every day and names every seller holding a box that should have been theirs. Catalogues are unlimited — this is one brand’s shelf, not our ceiling.
July 2026 monitoring cycle, as of 31 July. Platform shown through the H.Koenig account, with H.Koenig's permission, for data demonstration purposes.
Case study and research
One client's ledger, and the two questions every brand asks once they have seen it.
Platform shown through the H.Koenig account, with H.Koenig's permission, for data demonstration purposes.
Go deeper
The latest intel on how buy boxes are set, new legislation across the jurisdictions we cover, how to enforce MAP legally, and breakdowns on dealing with rogue sellers — and how to approach each of them using the right ecommerce intelligence.
We’ll use your details to respond to this request. See our Privacy Notice.
{{ page.eyebrow }}
{{ page.sub }}
{{ page.clientCaption }}
{{ page.eyebrow }}
{{ page.sub }}
Platform shown through a client account, with permission, for data demonstration purposes.
{{ art.eyebrow }}
{{ art.sub }}
{{ art.pageNote }}
{{ art.byline }}
{{ art.bylineRole }}
{{ art.disclaimer }}
{{ art.standfirst }}
{{ p.text }}
{{ p.text }}
{{ p.text }}
| {{ col }} |
|---|
| {{ cell.v }} |
{{ r }}
Legal
{{ legalDoc.version }}
{{ rn.t }}
| {{ hd }} |
|---|
| {{ cl.v }} |
{{ rn.t }}
| {{ hd }} |
|---|
| {{ cl.v }} |
{{ legalDoc.lastUpdated }} {{ legalDoc.foot }}
{{ b.eyebrow }}
{{ b.lede }}
{{ c.body }}
{{ c.detail }}
{{ c.body }}
{{ c.detail }}
Platform shown through the H.Koenig account, with H.Koenig's permission, for data demonstration purposes.
{{ b.eyebrow }}
{{ b.lede }}
Platform shown through the H.Koenig account, with H.Koenig's permission, for data demonstration purposes.
{{ b.eyebrow }}
{{ b.lede }}
{{ v.body }}
Hover a panel to play its recording. Platform shown through the H.Koenig account, with H.Koenig's permission, for data demonstration purposes.
{{ b.eyebrow }}
{{ b.lede }}
{{ b.eyebrow }}
{{ b.lede }}
{{ b.eyebrow }}
{{ s.body }}
{{ b.eyebrow }}
{{ b.lede }}
{{ p }}
{{ s.pull }}
{{ b.note }}
{{ b.eyebrow }}
{{ b.lede }}
| {{ c }} |
|---|
| {{ cell.v }} |
{{ b.note }}
{{ b.eyebrow }}
{{ b.lede }}
| {{ c }} | |||||
|---|---|---|---|---|---|
| {{ r.retailer }} | {{ r.market }} | {{ r.categories }} | {{ r.buybox }} | {{ r.refresh }} | {{ r.added }} |
{{ b.note }}
{{ b.eyebrow }}
{{ b.lede }}
{{ b.eyebrow }}
{{ b.lede }}
{{ b.note }}
Platform shown through the H.Koenig account, with H.Koenig's permission, for data demonstration purposes.
{{ b.eyebrow }}
{{ b.lede }}
{{ b.note }}
Platform shown through the H.Koenig account, with H.Koenig's permission, for data demonstration purposes.
{{ b.eyebrow }}
{{ b.lede }}
{{ p.body }}
{{ b.note }}
{{ b.eyebrow }}
{{ b.lede }}
{{ s.value }}
{{ s.label }}
{{ s.sub }}
{{ b.note }}
{{ b.eyebrow }}
{{ b.lede }}
A workbook is generated at the end of each scan cycle. The first one appears here once your first scan completes.
Get a free audit of your listings{{ exportSheet.footnote }}
{{ b.note }}
{{ b.eyebrow }}
{{ b.lede }}
{{ b.aside }}
{{ b.eyebrow }}
Page not found
The link may be old, or we may have moved it. Nothing is broken on your side.
{{ b.eyebrow }}
Buy-box hold rate
Alerts by kind, by week
{{ b.note }}