


{{ w.title }}
- {{ p }}
Platform · Alerts
Alerts records each material change to your distribution and delivers it against the scan that found it. Filter by retailer, market, category or severity and the queue becomes one person's assigned work.
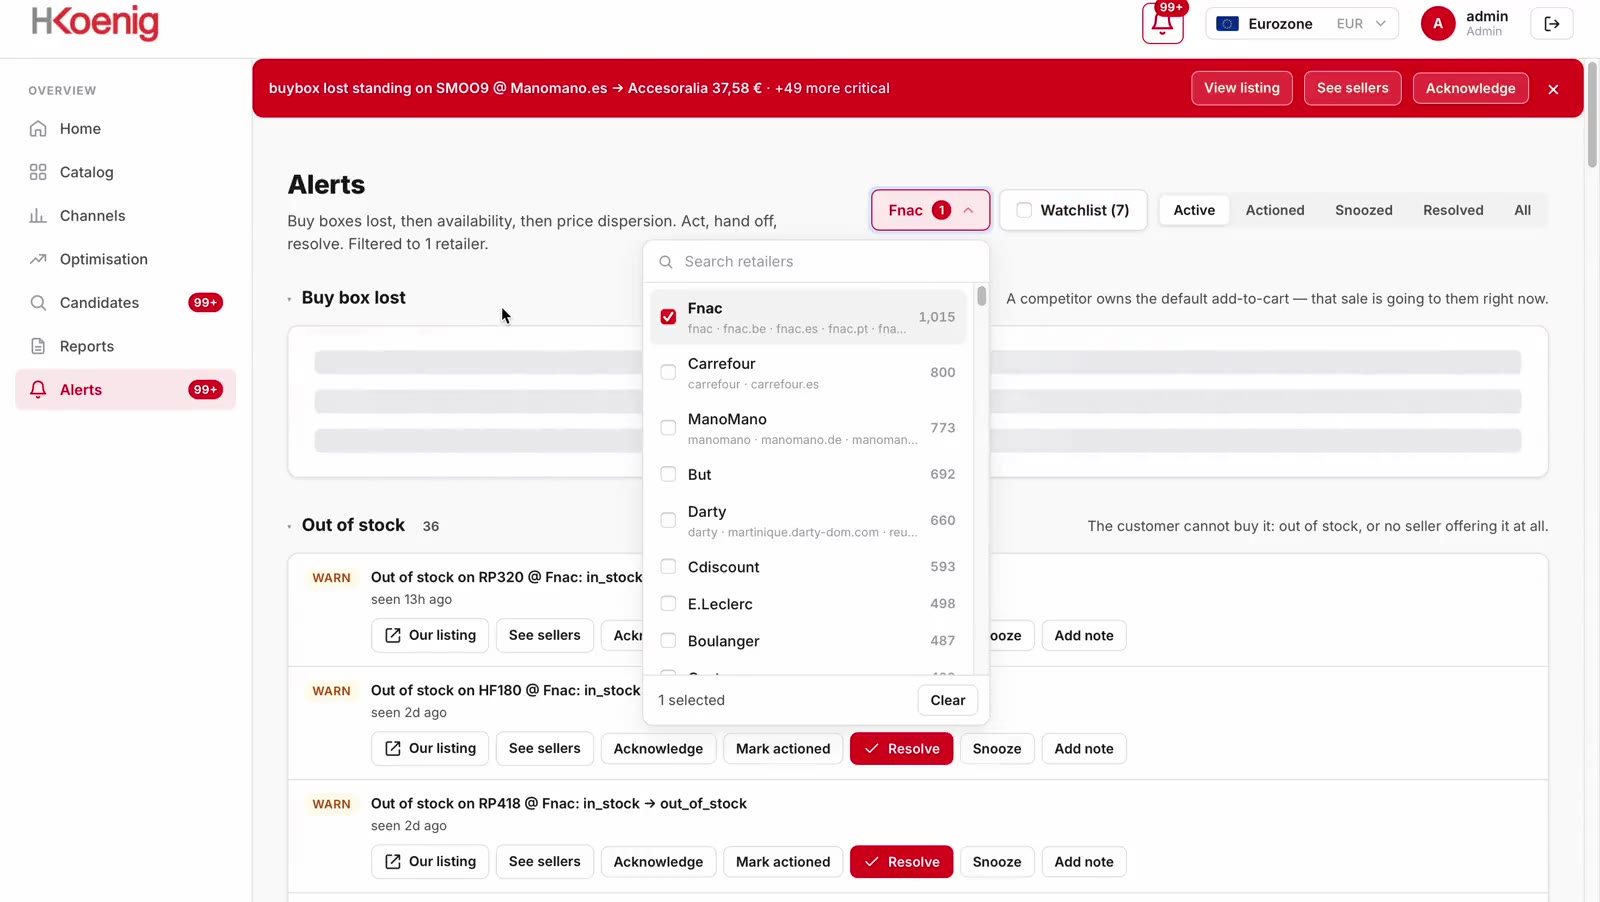
Platform shown through a client account, with permission, for data demonstration purposes.
What is on it
Each item shows what changed, the value it changed from, when it was first observed, and whether anyone has taken it. Filters sit across the top and each carries its live count, so narrowing the queue to your own retailers is a single action rather than a request. Items are raised against the scan that found them, which means a buy box lost on a Tuesday is a Tuesday item rather than a line in a month-end summary. By the time a monthly report reaches a commercial team, the seller who took that listing has held it for three weeks and the price has usually settled at the new level.
The six categories
Each category is a distinct change with a distinct owner, which is why they are reported separately rather than combined into a single severity score. Commercial teams work the pricing and buy-box categories; supply teams work availability and coverage. Neither has to read through the other's items to find their own.
Another seller has taken the buy box on a listing you were holding.
Includes the seller, their price, and the gap to your reference price.
A seller has appeared on one of your products who was not present at the previous scan.
The earliest point at which uncontrolled supply becomes observable.
Prices on a single listing have diverged beyond your tolerance, typically several sellers repricing against each other.
157 items were open on one client retailer at a single August scan.
A live listing that cannot be ordered, with duration measured from the first failed reading.
Not from the point someone noticed, which is what most systems report.
A second page created on one of your products by a seller with no supply relationship.
Substantially easier to have removed in the first week than in the first year.
Advertised price below your reference price for that market, by seller and by retailer.
Reported as observed fact. Permitted responses vary by jurisdiction.
A retailer you requested has gone live, or an existing retailer has changed how its pages are structured.
Reported so a shift in your figures is never mistaken for a shift in the market.
Fields and columns
Identical across all categories, so a filtered queue stays readable.
| Column | Contents | Purpose |
|---|---|---|
| Category | Which of the changes occurred | Category determines the owner |
| Product and retailer | Which listing, on which retailer | Enough to act from the row |
| Previous / current | The value before and after | The change, not only the state |
| Severity | Sized on revenue at risk | Not on discount percentage |
| First observed | When the change was captured | Age is the pressure |
| Owner | Who has taken the item | Makes recurrence visible |
Items are recorded against the previous scan rather than a rolling average, so each change appears once, on the day it occurred, and ages from that point. Nothing is re-raised on the following scan because the condition still holds, which is what keeps a queue workable over a long cycle.
How to read volume
A total item count rises with catalogue size and tells you very little. What matters is the composition and its direction: dispersion rising while lost buy boxes hold steady is a different problem, with a different owner, from the reverse. The chart is divided by category for that reason.
Weekly series shown is illustrative of the reporting structure. One client's monthly workbook recorded 8,263 items across the cycle.
Chart: alert volume by week, split by kind — boxes lost, availability, price dispersion and rogue sellers.
The workflow
The unfiltered queue is an account-wide count. Filtered to your retailers and categories it becomes a finite list with an owner.
Newest-first is the wrong order when severity is sized on revenue. The most expensive item is rarely the most recent.
Taking ownership keeps the open count accurate and turns a repeat seller into a visible pattern rather than a recurring surprise.
Exactly as scoped, one sheet per category, so items reach whoever is carrying out the work rather than only the person holding the login.
Related
Seven screens, one daily scan underneath all of them.
The problem
Right now, a seller you never appointed a reseller with your stock a marketplace trader an account you cannot name somebody undercutting you is costing you revenue and losing you customers.
They win the sale on a listing you built, to a customer who believes they bought from you. If that order arrives late, damaged or grey-market, you lose a customer and the revenue both — and neither ever appeared in your channel to begin with.
Undercutting is only the visible half. The rest of the damage never announces itself.
And it is never just one thing
A lost buy box is the one you can see. Merqi reads all seven on the same scan, so the damage you have not noticed shows up beside the damage you have.
Why one row matters
The featured offer is not a ranking, it is the default. The other sellers sit behind a link most shoppers never open, and on mobile they are not on screen at all. So when someone else holds the box on your listing, the page still converts — for them, on your product, at a price you did not set.
What a lost box actually costsThe size of the prize
10–30%+
revenue our clients can recover
Every buy box lost to an unauthorised seller is a sale made at a price you did not set, on a listing you paid to build. Recovering those listings, closing the coverage gaps and holding distributors to their terms is where the range above comes from.
See what one scan cycle foundIndicative range. What Merqi recovers for your catalogue depends on how many of your listings are contested and how far price has drifted — the first report tells you which.
How it works
Every finding starts as a row in the same scan. What changes is the question you bring to it.
Platform shown through the H.Koenig account, with H.Koenig's permission, for data demonstration purposes.
What you get
The first two are what most brands come for. The rest is what they did not know they were missing — and the platform they read it all in.
See everything the platform reads{{ c.body }}
{{ c.detail }}
{{ c.body }}
{{ c.detail }}
On one client account, Merqi reads 4,196 listings across 78 active retailers every day and names every seller holding a box that should have been theirs. Catalogues are unlimited — this is one brand’s shelf, not our ceiling.
July 2026 monitoring cycle, as of 31 July. Platform shown through the H.Koenig account, with H.Koenig's permission, for data demonstration purposes.
Case study and research
One client's ledger, and the two questions every brand asks once they have seen it.
Platform shown through the H.Koenig account, with H.Koenig's permission, for data demonstration purposes.
Go deeper
The latest intel on how buy boxes are set, new legislation across the jurisdictions we cover, how to enforce MAP legally, and breakdowns on dealing with rogue sellers — and how to approach each of them using the right ecommerce intelligence.
We’ll use your details to respond to this request. See our Privacy Notice.
{{ page.eyebrow }}
{{ page.sub }}
{{ page.clientCaption }}
{{ page.eyebrow }}
{{ page.sub }}
Platform shown through a client account, with permission, for data demonstration purposes.
{{ art.eyebrow }}
{{ art.sub }}
{{ art.pageNote }}
{{ art.byline }}
{{ art.bylineRole }}
{{ art.disclaimer }}
{{ art.standfirst }}
{{ p.text }}
{{ p.text }}
{{ p.text }}
| {{ col }} |
|---|
| {{ cell.v }} |
{{ r }}
Legal
{{ legalDoc.version }}
{{ rn.t }}
| {{ hd }} |
|---|
| {{ cl.v }} |
{{ rn.t }}
| {{ hd }} |
|---|
| {{ cl.v }} |
{{ legalDoc.lastUpdated }} {{ legalDoc.foot }}
{{ b.eyebrow }}
{{ b.lede }}
{{ c.body }}
{{ c.detail }}
{{ c.body }}
{{ c.detail }}
Platform shown through the H.Koenig account, with H.Koenig's permission, for data demonstration purposes.
{{ b.eyebrow }}
{{ b.lede }}
Platform shown through the H.Koenig account, with H.Koenig's permission, for data demonstration purposes.
{{ b.eyebrow }}
{{ b.lede }}
{{ v.body }}
Hover a panel to play its recording. Platform shown through the H.Koenig account, with H.Koenig's permission, for data demonstration purposes.
{{ b.eyebrow }}
{{ b.lede }}
{{ b.eyebrow }}
{{ b.lede }}
{{ b.eyebrow }}
{{ s.body }}
{{ b.eyebrow }}
{{ b.lede }}
{{ p }}
{{ s.pull }}
{{ b.note }}
{{ b.eyebrow }}
{{ b.lede }}
| {{ c }} |
|---|
| {{ cell.v }} |
{{ b.note }}
{{ b.eyebrow }}
{{ b.lede }}
| {{ c }} | |||||
|---|---|---|---|---|---|
| {{ r.retailer }} | {{ r.market }} | {{ r.categories }} | {{ r.buybox }} | {{ r.refresh }} | {{ r.added }} |
{{ b.note }}
{{ b.eyebrow }}
{{ b.lede }}
{{ b.eyebrow }}
{{ b.lede }}
{{ b.note }}
Platform shown through the H.Koenig account, with H.Koenig's permission, for data demonstration purposes.
{{ b.eyebrow }}
{{ b.lede }}
{{ b.note }}
Platform shown through the H.Koenig account, with H.Koenig's permission, for data demonstration purposes.
{{ b.eyebrow }}
{{ b.lede }}
{{ p.body }}
{{ b.note }}
{{ b.eyebrow }}
{{ b.lede }}
{{ s.value }}
{{ s.label }}
{{ s.sub }}
{{ b.note }}
{{ b.eyebrow }}
{{ b.lede }}
A workbook is generated at the end of each scan cycle. The first one appears here once your first scan completes.
Get a free audit of your listings{{ exportSheet.footnote }}
{{ b.note }}
{{ b.eyebrow }}
{{ b.lede }}
{{ b.aside }}
{{ b.eyebrow }}
Page not found
The link may be old, or we may have moved it. Nothing is broken on your side.
{{ b.eyebrow }}
Buy-box hold rate
Alerts by kind, by week
{{ b.note }}