


{{ w.title }}
- {{ p }}
 Small domestic appliances

Case study · H.Koenig
H.Koenig sell small domestic appliances across French and European retail. Nobody could say who held the buy box, which listings had been duplicated, or where price had drifted — so we built the infrastructure with their commercial and supply teams until it could.
H.Koenig sell small domestic appliances from Paris across French and European retail — marketplaces, own-shelf retailers and the distributors in between.
The real numbers
Not a projection. Every figure below is a count from the client's own July monitoring workbook, and each says what it counts. The scoped August exports elsewhere on this site cover a different cycle, so their totals differ.
4,196
listings monitored
Across the full reference list, read every day
78
active retailers and marketplaces
Marketplaces and own-shelf retailers carrying the brand
1,059
buy boxes held
At an 85.5% hold rate across the catalogue
116
boxes lost during the month
With 275 rewon, and 184 still lost at cycle end
185
listings out of stock
Live pages nobody could order from
23
repeat attackers
Sellers taking boxes more than once — Gpasplus took 28
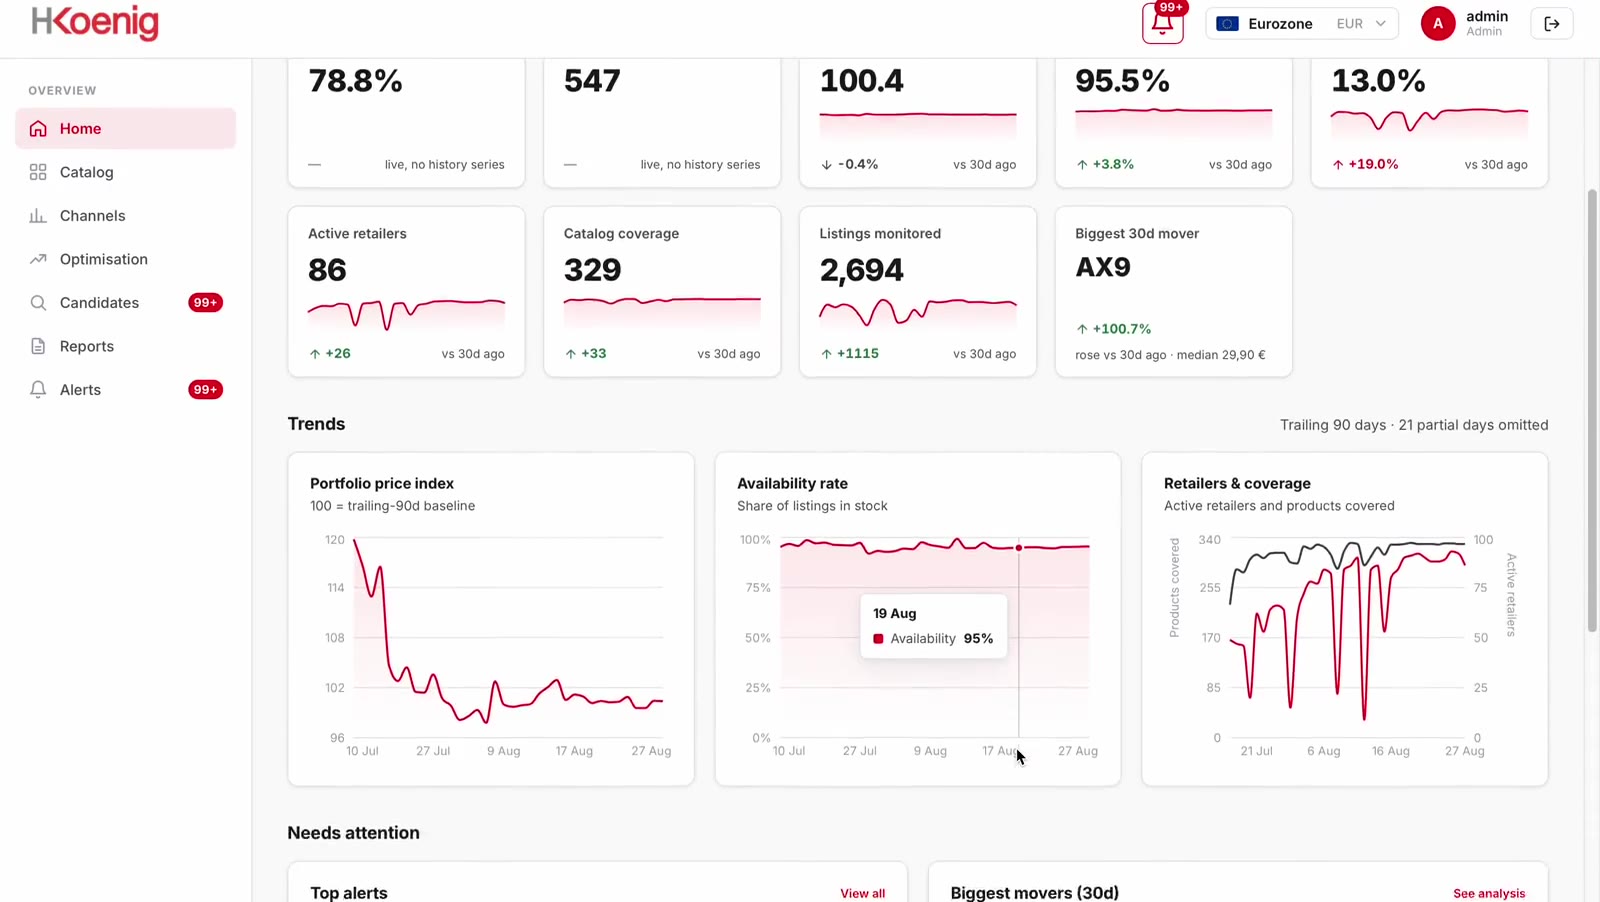
Every figure is from the H.Koenig July 2026 monitoring workbook, Summary sheet, as of 31 July — one account, one cycle, reproducible from the platform on request. Figures elsewhere on this page scoped to a single shelf or a single day say so. Platform shown through the H.Koenig account, with H.Koenig's permission, for data demonstration purposes.
The size of the prize
One channel, one day, and every leak on it invisible before the first scan. Dispersion is your own stock racing itself down a single page. Boxes lost are sales made at somebody else's price on a listing you built. Unbuyable pages are traffic arriving where nobody can order. Duplicates are pages you never created. Coverage gaps are shelves you were never on. Recovering even part of each is where the range comes from.
Chart: open alert counts on one channel for one day — 157 price dispersion, 36 buy boxes lost, 27 unbuyable pages, 1 duplicate listing.
Open alert counts from one export file — Carrefour scope, 28 August 2026 — so the bars are comparable with each other. Account-wide across the July cycle the same catalogue showed 116 boxes lost in the month and 184 still lost at month end, across 78 retailers. Coverage gaps are scoped per client and carry no count here. No euro figure is implied: what these are worth on your catalogue comes out of your own first report.
How it was built
The first version answered one question: who holds the box. Everything after that came from sitting with the people who had to act on it. The commercial team needed the seller named and the gap in euros, not a score. Supply needed out-of-stock separated from delisted, because those are two different phone calls. Duplicate-listing detection exists because their team kept finding pages they had never created. We build features with the client, ship them, and keep going.
See the platformPlatform shown through the H.Koenig account, with H.Koenig's permission, for data demonstration purposes.
The outcome
Every listing where another seller was competing for the add-to-cart, on one channel, on one day. The eleven they lost are not a rounding error in a dashboard — each is a named seller, a captured price and a dated row their commercial team can act on that afternoon.
Darty channel export, pulled 11:43 UTC on 29 August 2026: 378 contested listings across 297 references, 367 held, 11 lost, 24 out of stock. A shelf is counted several ways — contested listings, references carried, references monitored — so each figure on this site says which. Platform shown through the H.Koenig account, with H.Koenig's permission, for data demonstration purposes.
Chart: 367 of 378 contested listings held on one channel, a 97.1% win rate, with 11 lost.
What it surfaces
One scan, read six ways. Each is a real view in the platform with its own filters and its own export.
Who holds the box on every listing, the winning price against your reference, and the gap in euros.
Standing is read from the captured ownership timeline, never inferred from price.
Where advertised price sits against your policy, per seller, per retailer.
Reported for your commercial judgement. In the EU that is exactly what the rules permit, and it is what we built.
Unbuyable rows separated from delisted ones, with days-out counted from the first failed read.
27 open on Carrefour at the August pull, 24 on Darty.
Retailers carrying the category but not the products, kept apart from listed-but-unbuyable.
Per retailer and per market, so the gap is actionable.
Pages built on your references by sellers you never appointed, flagged the day they appear.
Added because their team kept finding pages nobody at H.Koenig had created.
Listings where seller prices diverge beyond tolerance — the clearest signal of leaked stock.
157 open at the August pull, some spreading nearly two to one.
Price dispersion
Each bar is one reference on one retailer in a single scan, drawn as a multiple of its own cheapest seller — so the longer the bar, the wider the gap between the cheapest and dearest offer on the same page. A spread like this is not a pricing strategy. It is stock reaching sellers nobody authorised, and it is the row that ends a distributor conversation quickly. On four of these five, the cheapest offer sits at H.Koenig's own reference price — so every other seller on the page is marked up from it.
Five of 157 open dispersion alerts, Carrefour scope, 28 August 2026. Platform shown through the H.Koenig account, with H.Koenig's permission, for data demonstration purposes.
Chart: five references plotted as a multiple of their own cheapest seller, the widest spreading beyond two to one.
The export
Not a locked PDF summary. Any view in the platform, with whatever filters you have applied, comes out as a real workbook — one sheet per question, headers you can pivot on, tabular figures.
Real sheets from the H.Koenig account, 28 and 29 August 2026 — rows exactly as exported. Sign conventions differ by sheet: the channel exports state how far our price sits above the box, the alert exports state a signed gap against the winning seller. Platform shown through the H.Koenig account, with H.Koenig's permission, for data demonstration purposes.
The monthly document
The workbook is the evidence. The monthly document is the argument — what moved, what it cost, and what to do about it, in language you can forward to a distributor without editing.
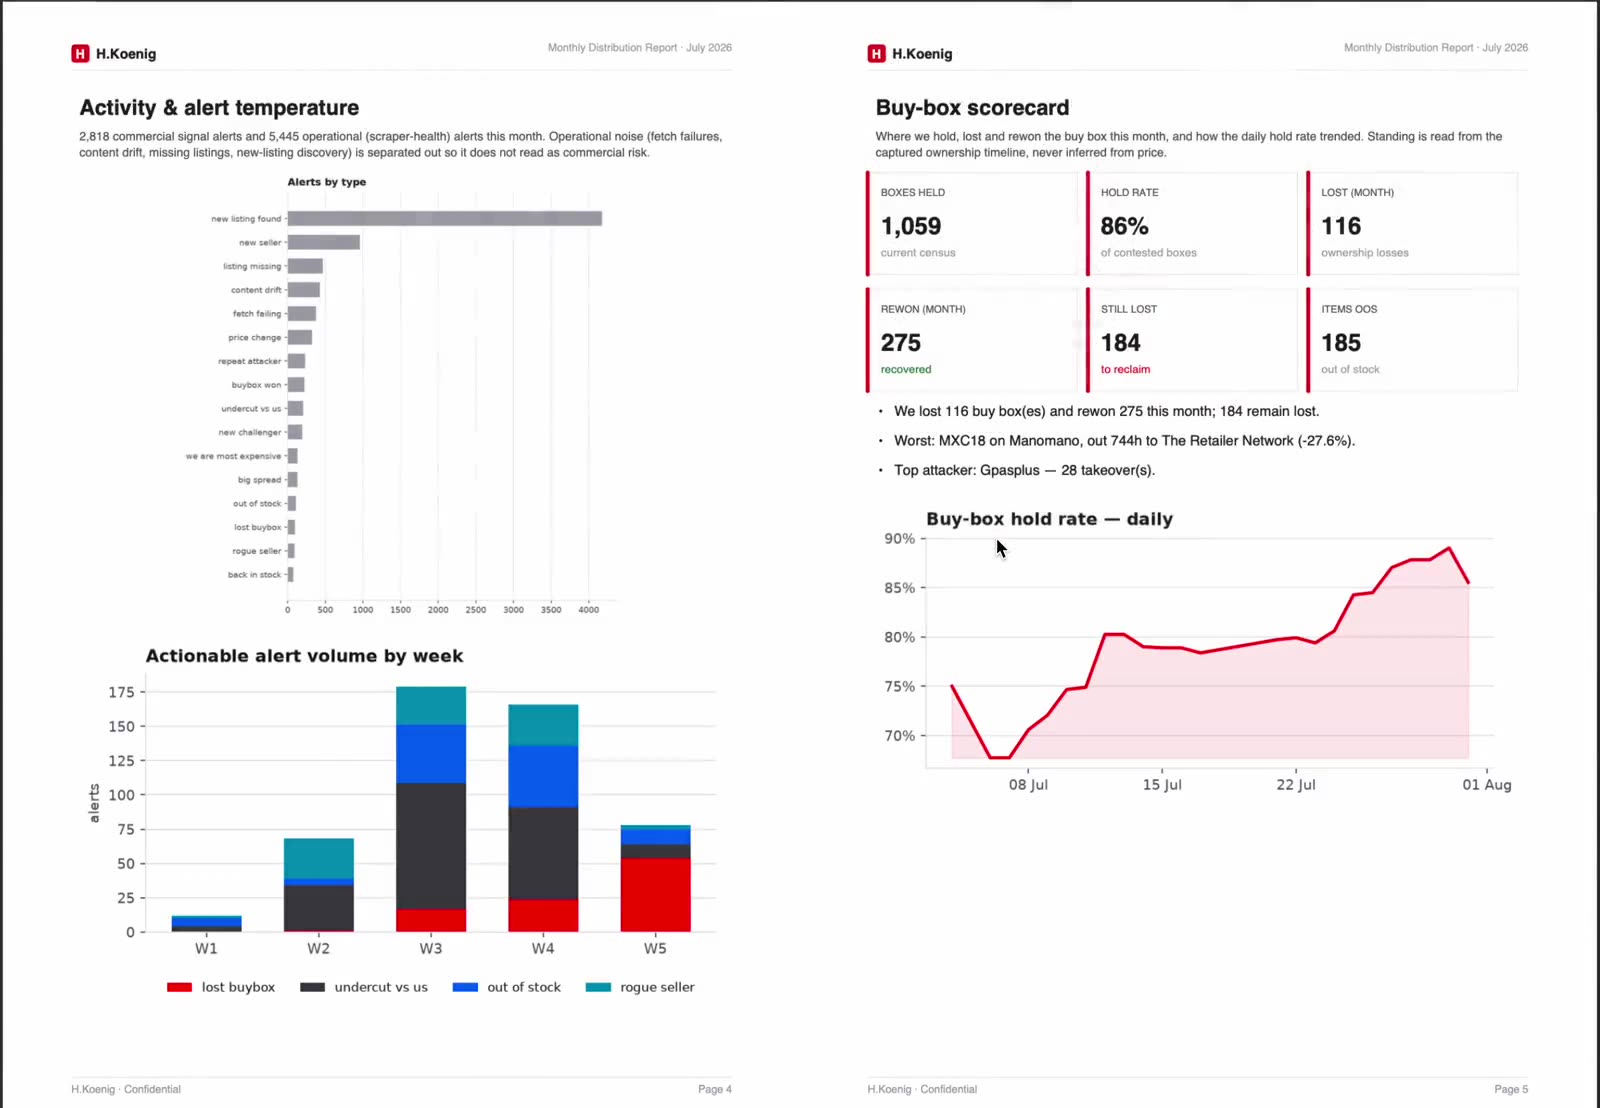
Platform shown through the H.Koenig account, with H.Koenig's permission, for data demonstration purposes.
In the platform
Commercial works Optimisation, supply works Channels and Catalog. One scan underneath all three.
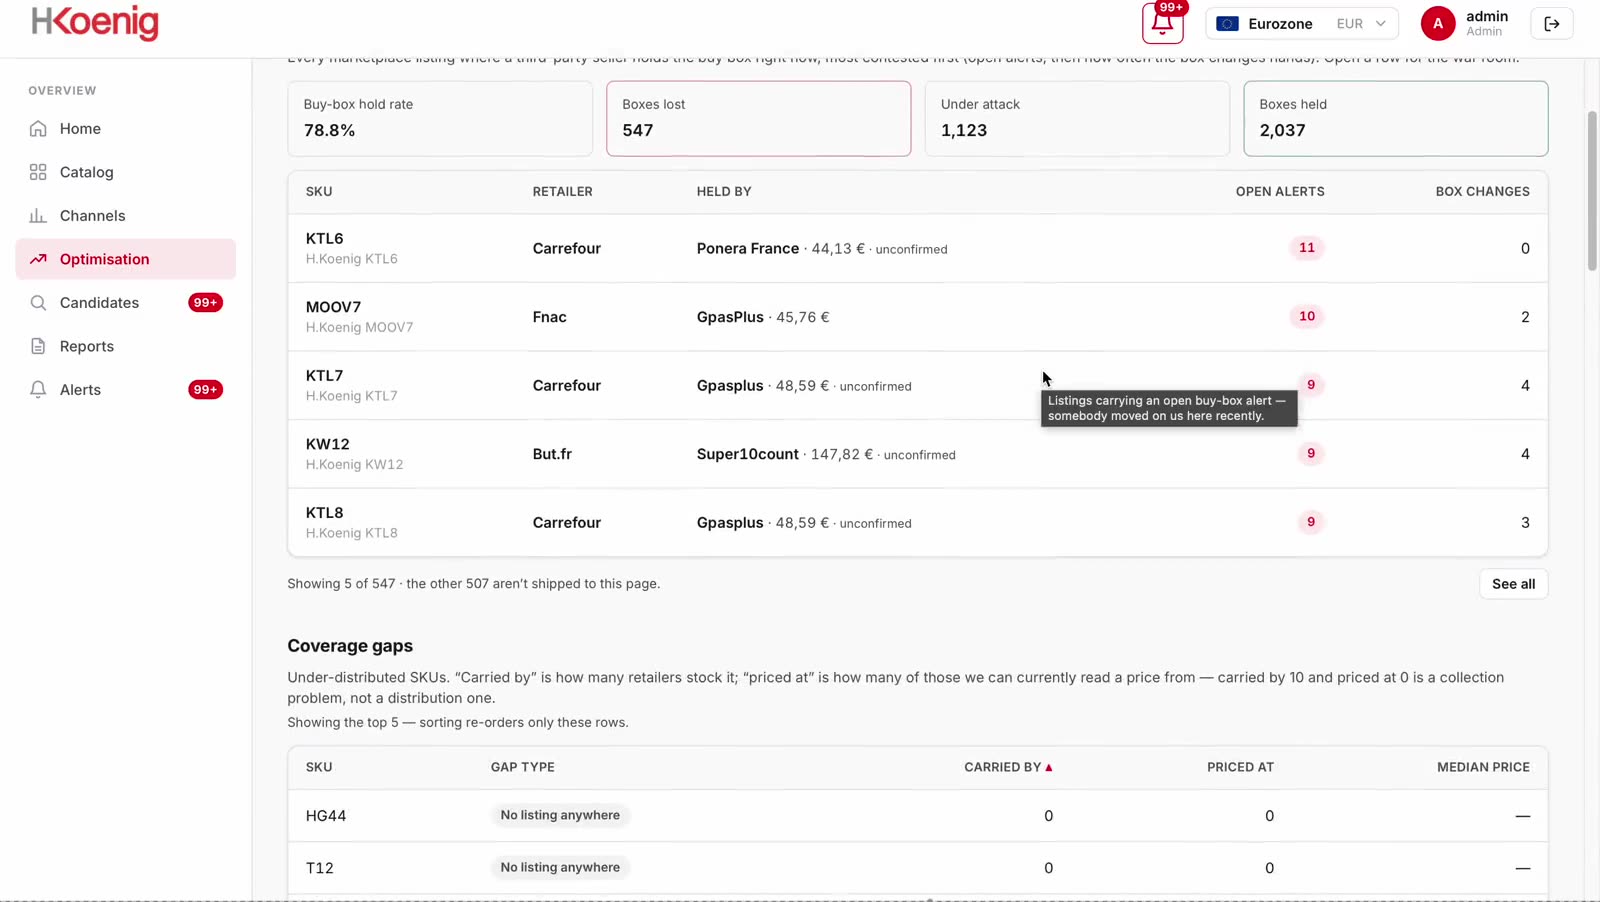
Every contested box, the seller holding it, and what to do about the row.
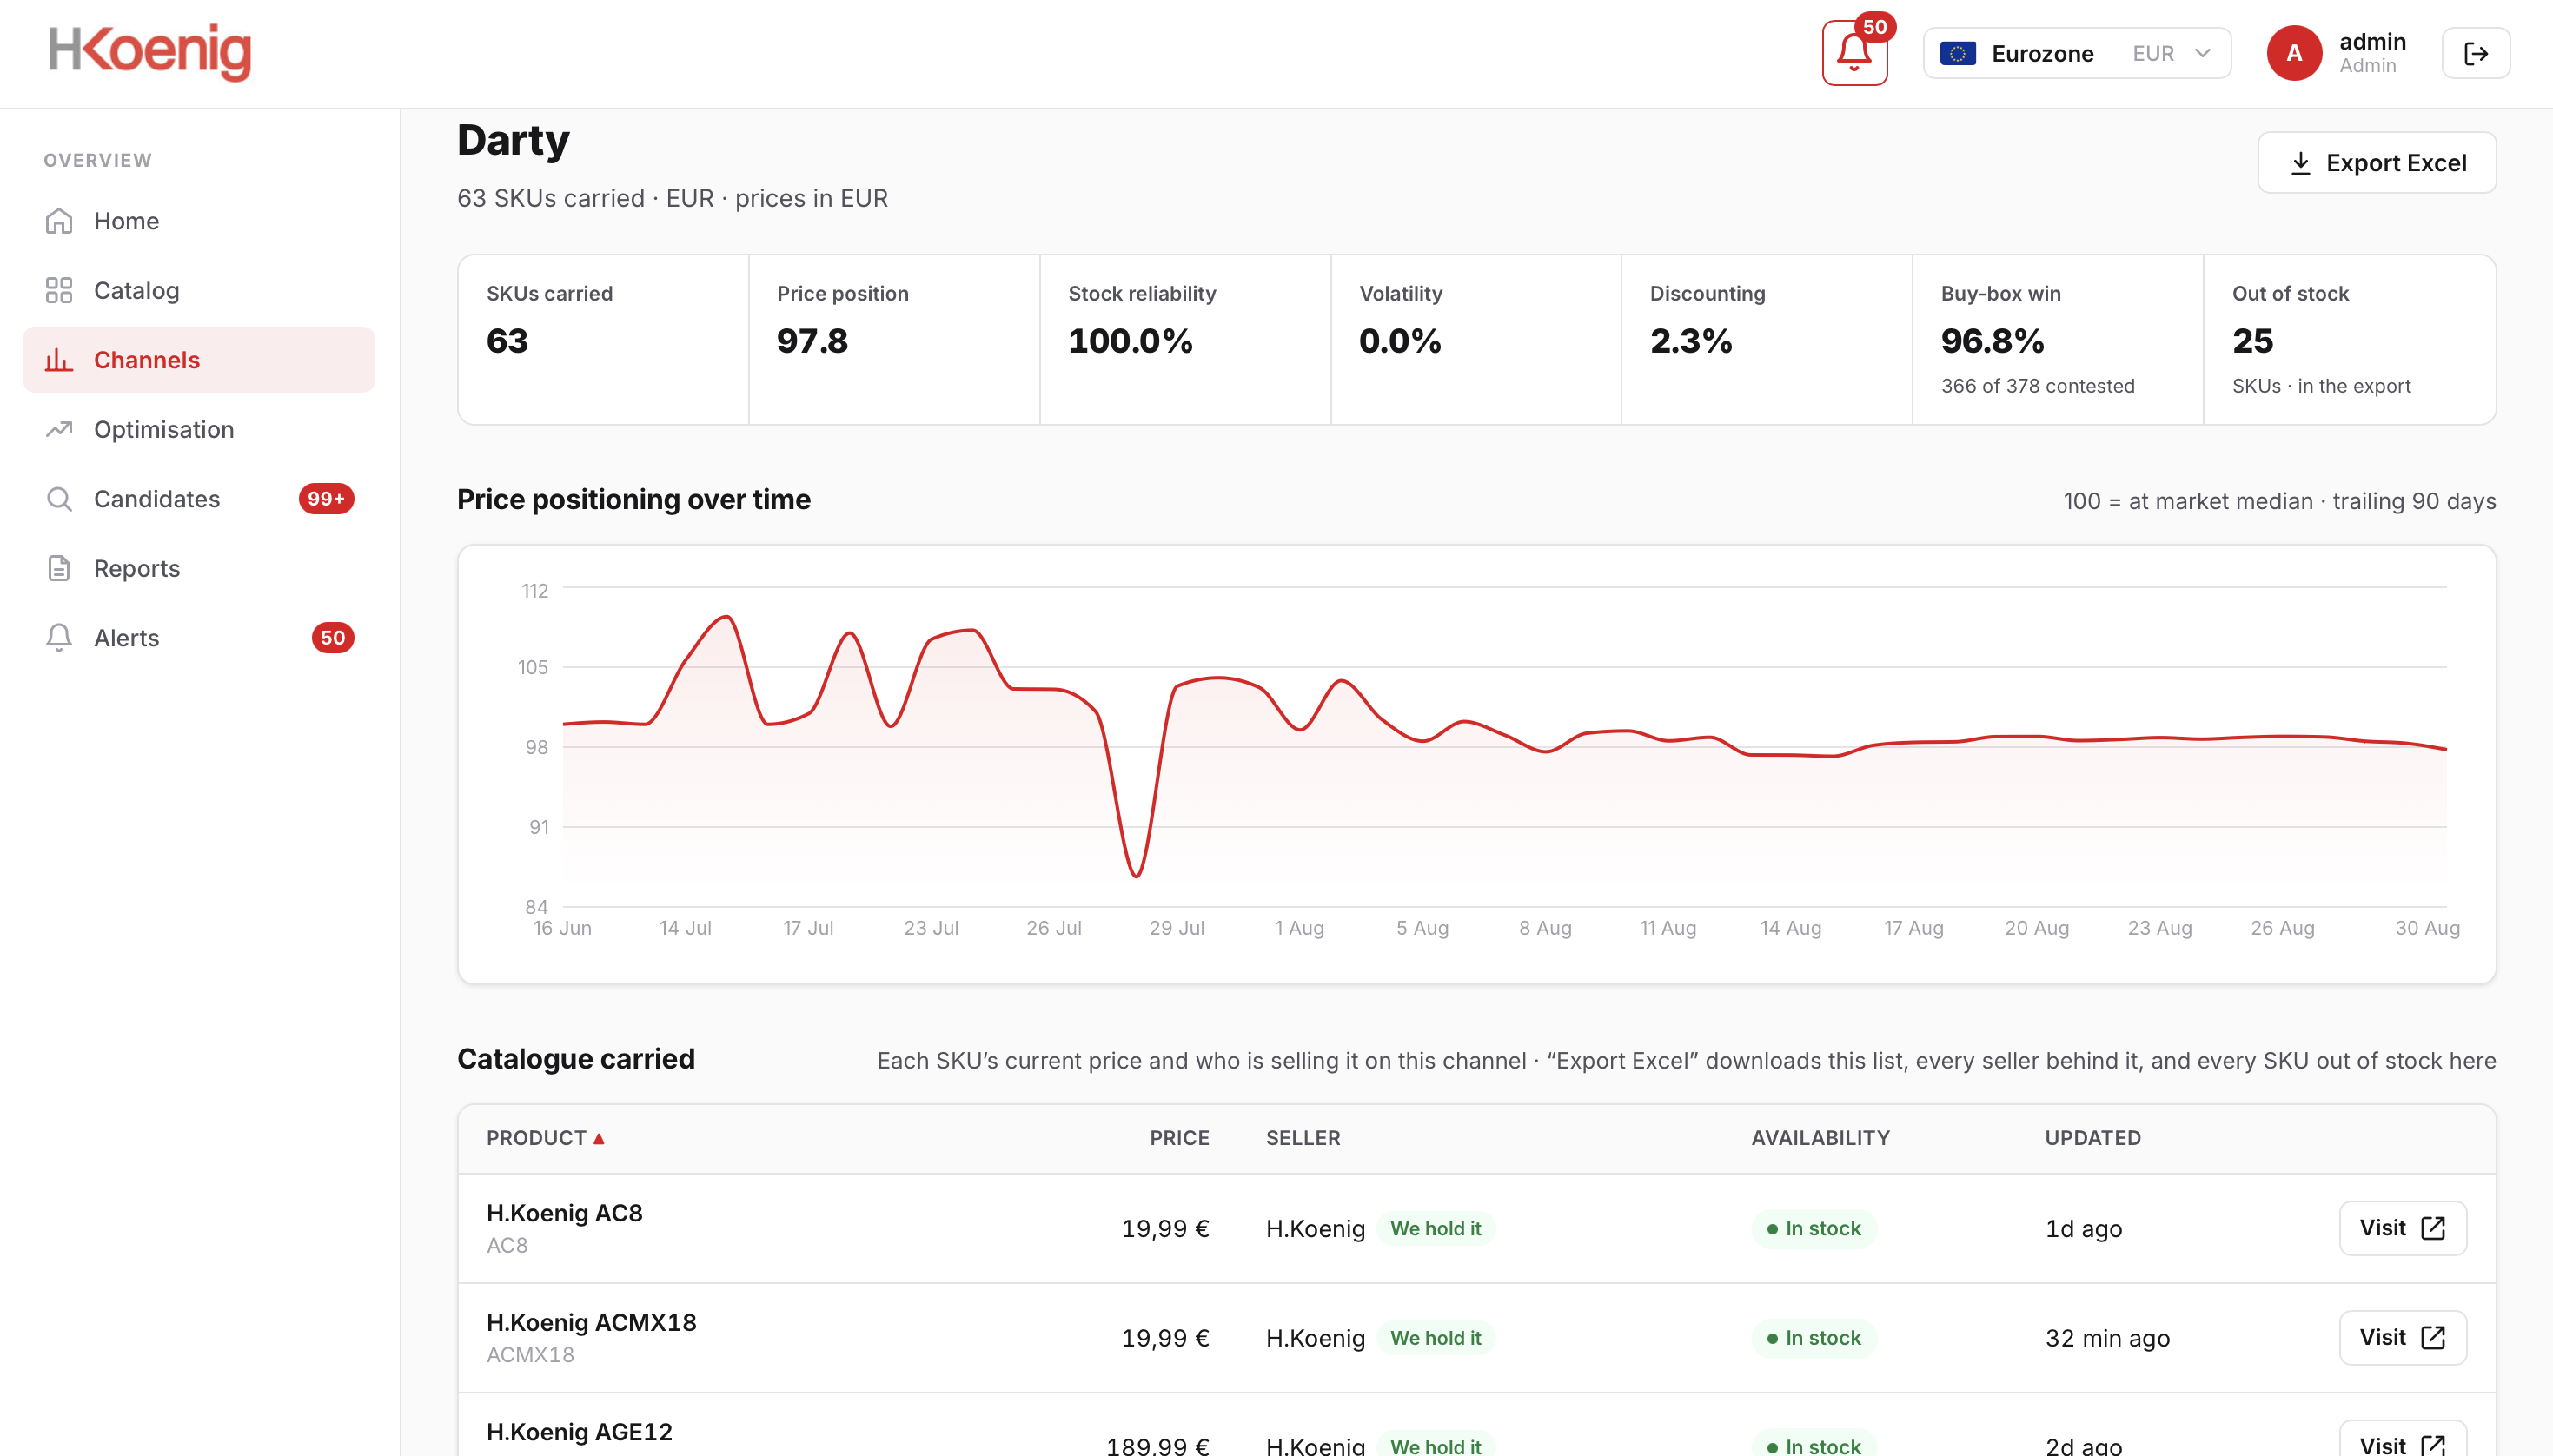
One shelf on its own — price position, stock reliability and what is out of stock, read day by day.
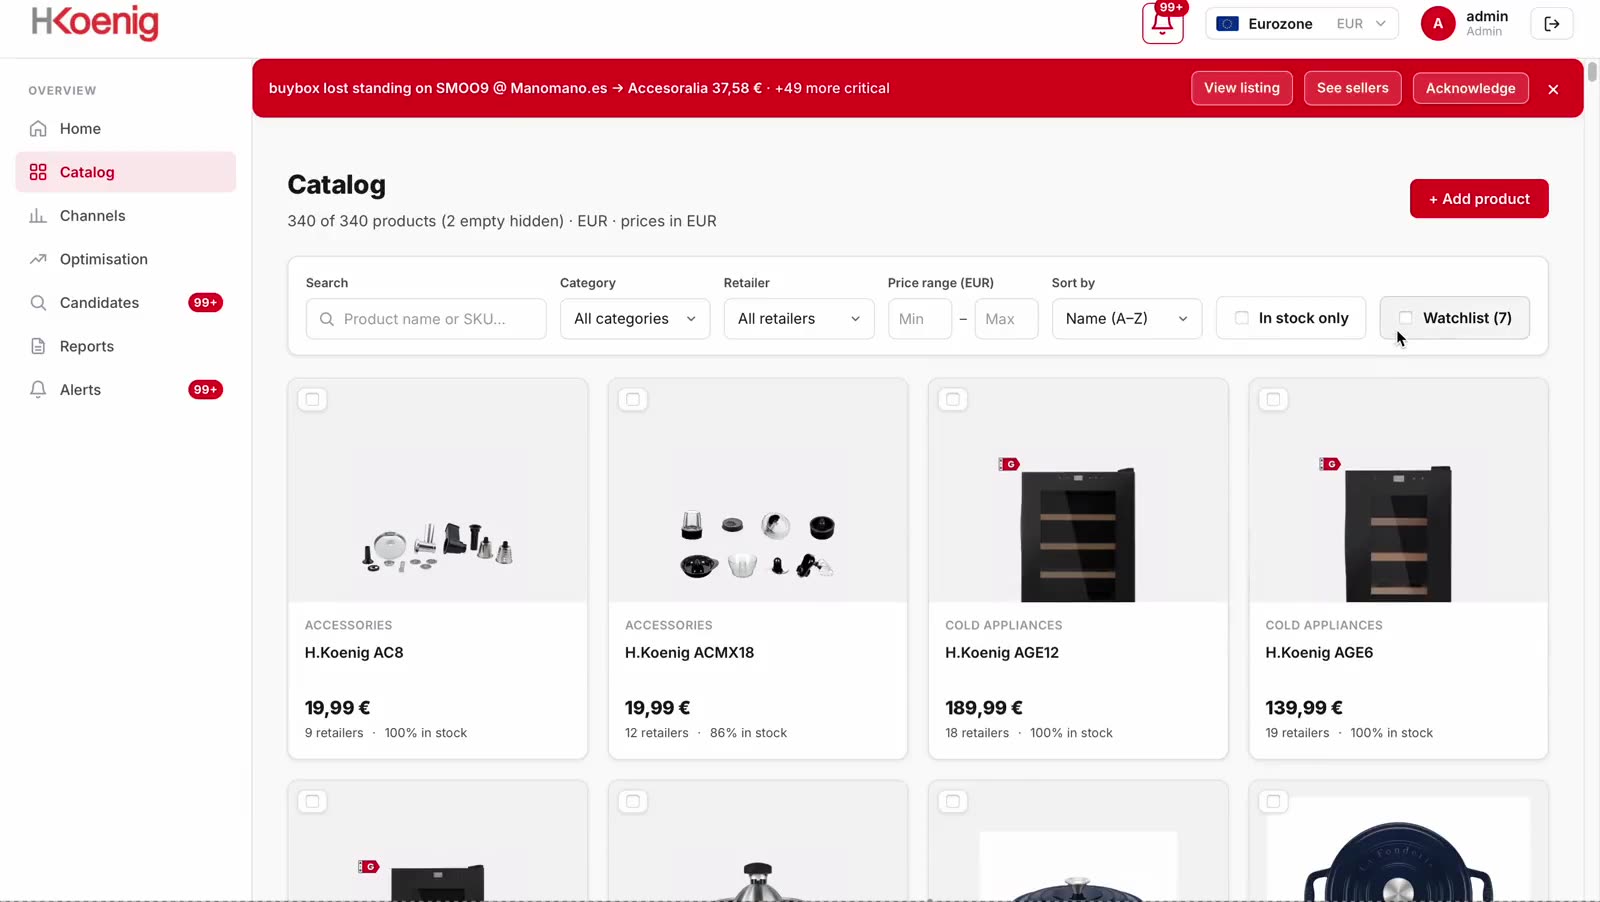
Every reference against every listing found for it, retailer by retailer.
Hover a panel to play its recording. Platform shown through the H.Koenig account, with H.Koenig's permission, for data demonstration purposes.
How we work
The platform H.Koenig use today is not the one we shipped them. It is the one their teams asked for, session by session.
The working relationship
Or whenever you ask for one. We go through what the platform found and what it missed.
A wrong row, a bad match, a retailer reading incorrectly — reported and fixed within the day.
Duplicate-listing detection, the stock split and the spread alert all came from client sessions, not a roadmap.
H.Koenig figures and platform footage appear here with H.Koenig's permission, for data demonstration purposes. The revenue figure above is the client's own projection of recoverable margin, not a Merqi guarantee.
The same thing, on your catalogue
H.Koenig started with a reference list and nothing else. Everything above came out of the scans that followed.
The problem
Right now, a seller you never appointed a reseller with your stock a marketplace trader an account you cannot name somebody undercutting you is costing you revenue and losing you customers.
They win the sale on a listing you built, to a customer who believes they bought from you. If that order arrives late, damaged or grey-market, you lose a customer and the revenue both — and neither ever appeared in your channel to begin with.
Undercutting is only the visible half. The rest of the damage never announces itself.
And it is never just one thing
A lost buy box is the one you can see. Merqi reads all seven on the same scan, so the damage you have not noticed shows up beside the damage you have.
Why one row matters
The featured offer is not a ranking, it is the default. The other sellers sit behind a link most shoppers never open, and on mobile they are not on screen at all. So when someone else holds the box on your listing, the page still converts — for them, on your product, at a price you did not set.
What a lost box actually costsThe size of the prize
10–30%+
revenue our clients can recover
Every buy box lost to an unauthorised seller is a sale made at a price you did not set, on a listing you paid to build. Recovering those listings, closing the coverage gaps and holding distributors to their terms is where the range above comes from.
See what one scan cycle foundIndicative range. What Merqi recovers for your catalogue depends on how many of your listings are contested and how far price has drifted — the first report tells you which.
How it works
Every finding starts as a row in the same scan. What changes is the question you bring to it.
Platform shown through the H.Koenig account, with H.Koenig's permission, for data demonstration purposes.
What you get
The first two are what most brands come for. The rest is what they did not know they were missing — and the platform they read it all in.
See everything the platform reads{{ c.body }}
{{ c.detail }}
{{ c.body }}
{{ c.detail }}
On one client account, Merqi reads 4,196 listings across 78 active retailers every day and names every seller holding a box that should have been theirs. Catalogues are unlimited — this is one brand’s shelf, not our ceiling.
July 2026 monitoring cycle, as of 31 July. Platform shown through the H.Koenig account, with H.Koenig's permission, for data demonstration purposes.
Case study and research
One client's ledger, and the two questions every brand asks once they have seen it.
Platform shown through the H.Koenig account, with H.Koenig's permission, for data demonstration purposes.
Go deeper
The latest intel on how buy boxes are set, new legislation across the jurisdictions we cover, how to enforce MAP legally, and breakdowns on dealing with rogue sellers — and how to approach each of them using the right ecommerce intelligence.
We’ll use your details to respond to this request. See our Privacy Notice.
{{ page.eyebrow }}
{{ page.sub }}
{{ page.clientCaption }}
{{ page.eyebrow }}
{{ page.sub }}
Platform shown through a client account, with permission, for data demonstration purposes.
{{ art.eyebrow }}
{{ art.sub }}
{{ art.pageNote }}
{{ art.byline }}
{{ art.bylineRole }}
{{ art.disclaimer }}
{{ art.standfirst }}
{{ p.text }}
{{ p.text }}
{{ p.text }}
| {{ col }} |
|---|
| {{ cell.v }} |
{{ r }}
Legal
{{ legalDoc.version }}
{{ rn.t }}
| {{ hd }} |
|---|
| {{ cl.v }} |
{{ rn.t }}
| {{ hd }} |
|---|
| {{ cl.v }} |
{{ legalDoc.lastUpdated }} {{ legalDoc.foot }}
{{ b.eyebrow }}
{{ b.lede }}
{{ c.body }}
{{ c.detail }}
{{ c.body }}
{{ c.detail }}
Platform shown through the H.Koenig account, with H.Koenig's permission, for data demonstration purposes.
{{ b.eyebrow }}
{{ b.lede }}
Platform shown through the H.Koenig account, with H.Koenig's permission, for data demonstration purposes.
{{ b.eyebrow }}
{{ b.lede }}
{{ v.body }}
Hover a panel to play its recording. Platform shown through the H.Koenig account, with H.Koenig's permission, for data demonstration purposes.
{{ b.eyebrow }}
{{ b.lede }}
{{ b.eyebrow }}
{{ b.lede }}
{{ b.eyebrow }}
{{ s.body }}
{{ b.eyebrow }}
{{ b.lede }}
{{ p }}
{{ s.pull }}
{{ b.note }}
{{ b.eyebrow }}
{{ b.lede }}
| {{ c }} |
|---|
| {{ cell.v }} |
{{ b.note }}
{{ b.eyebrow }}
{{ b.lede }}
| {{ c }} | |||||
|---|---|---|---|---|---|
| {{ r.retailer }} | {{ r.market }} | {{ r.categories }} | {{ r.buybox }} | {{ r.refresh }} | {{ r.added }} |
{{ b.note }}
{{ b.eyebrow }}
{{ b.lede }}
{{ b.eyebrow }}
{{ b.lede }}
{{ b.note }}
Platform shown through the H.Koenig account, with H.Koenig's permission, for data demonstration purposes.
{{ b.eyebrow }}
{{ b.lede }}
{{ b.note }}
Platform shown through the H.Koenig account, with H.Koenig's permission, for data demonstration purposes.
{{ b.eyebrow }}
{{ b.lede }}
{{ p.body }}
{{ b.note }}
{{ b.eyebrow }}
{{ b.lede }}
{{ s.value }}
{{ s.label }}
{{ s.sub }}
{{ b.note }}
{{ b.eyebrow }}
{{ b.lede }}
A workbook is generated at the end of each scan cycle. The first one appears here once your first scan completes.
Get a free audit of your listings{{ exportSheet.footnote }}
{{ b.note }}
{{ b.eyebrow }}
{{ b.lede }}
{{ b.aside }}
{{ b.eyebrow }}
Page not found
The link may be old, or we may have moved it. Nothing is broken on your side.
{{ b.eyebrow }}
Buy-box hold rate
Alerts by kind, by week
{{ b.note }}