
{{ w.title }}
- {{ p }}
One monthly workbook
This is a single export from one client account — the whole monitoring cycle, not a summary of it.
8,263
alert rows
Every alert raised in the cycle, with what changed
71,578
snapshots captured
Individual page reads behind the figures
4,781
active listings
Live rows across every shelf we read
328
references
Min, median, mean, max and dispersion on each
223
contested listings
Times lost, times rewon, longest loss in hours
11
sheets
Summary, Buy-box War, Lost & Rewon Log, Repeat Attackers, Retailer Overview, Products, Channels, Markets, Price History, Alerts, Data Quality
From the July monitoring workbook. Platform shown through the H.Koenig account, with H.Koenig's permission, for data demonstration purposes.
Inside the workbook
Real sheets from a real export — column names and rows exactly as they download. Every figure traces back to a captured page read.
July monitoring workbook, one client account. Sign conventions differ by sheet: channel exports state how far our price sits above the box, alert exports state a signed gap against the winning seller. Platform shown through the H.Koenig account, with H.Koenig's permission, for data demonstration purposes.
What you can export
There is no premium tier for data access. If it is on your screen, it downloads.
The whole cycle in 11 sheets — scorecard, buy-box war, the lost-and-rewon log, repeat attackers, per-retailer overview, products, channels, markets, price history, every alert and a data-quality audit.
One file, generated each cycle, ready to pivot.
One retailer on its own: every buy box, every competing seller offer behind it, and every SKU out of stock on that shelf.
Exported straight from the Channels screen with the currency you are viewing in.
The alert queue scoped to one retailer, one severity or one date range — exports exactly as scoped, sheet per alert type.
Buy box lost, out of stock, duplicate listings, extreme dispersion, and everything else.
Catalog, Optimisation, Candidates, Reports. Every table in the platform has the same Export Excel button in the same place.
No API to integrate, no request to raise, no wait.
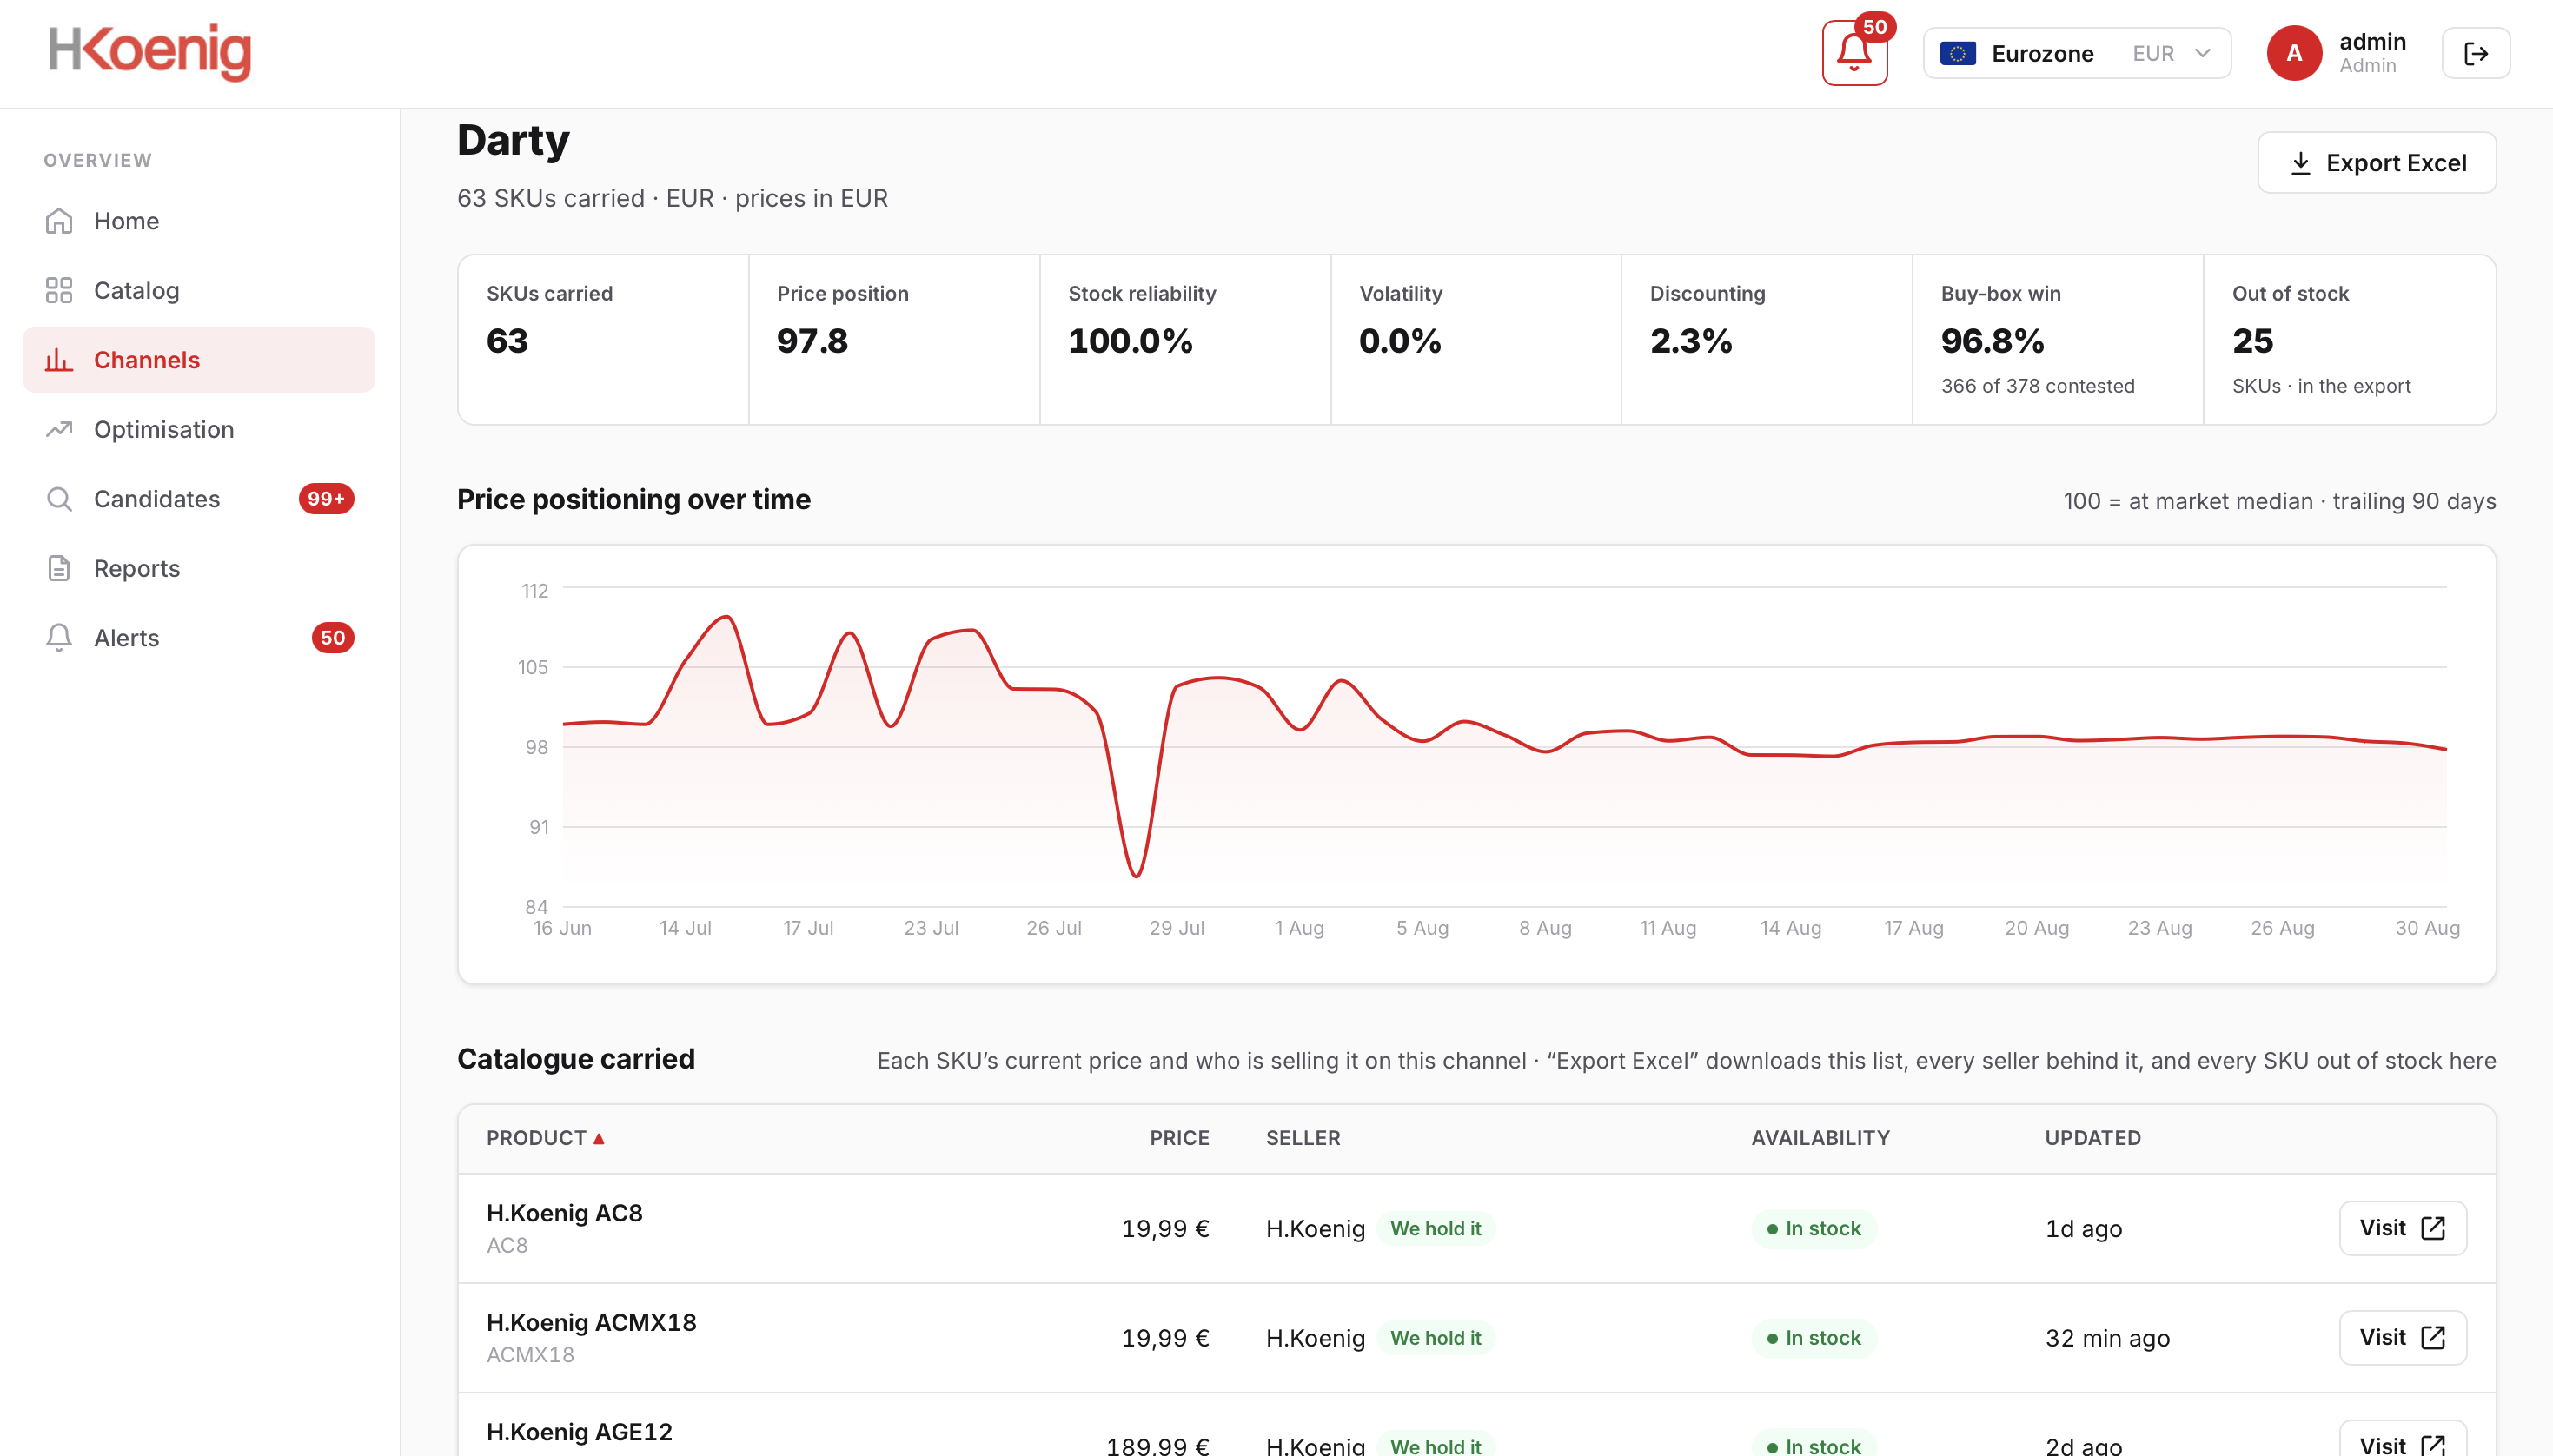
Where it lives
Top right of whatever you are looking at. The export carries the view you are in — on a channel that means the catalogue carried, every seller behind each listing, and every SKU out of stock on that shelf, in the currency shown.
See the platformPlatform shown through the H.Koenig account, with H.Koenig's permission, for data demonstration purposes.
Why it matters
Tabular figures, real headers, one sheet per question. Pivot it, chart it, join it to your own sales data.
A distributor conversation needs dated rows, not a screenshot of a dashboard.
There is no sampled tier and no row cap. The workbook contains what the platform captured.
The problem
Right now, a seller you never appointed a reseller with your stock a marketplace trader an account you cannot name somebody undercutting you is costing you revenue and losing you customers.
They win the sale on a listing you built, to a customer who believes they bought from you. If that order arrives late, damaged or grey-market, you lose a customer and the revenue both — and neither ever appeared in your channel to begin with.
Undercutting is only the visible half. The rest of the damage never announces itself.
And it is never just one thing
A lost buy box is the one you can see. Merqi reads all seven on the same scan, so the damage you have not noticed shows up beside the damage you have.
Why one row matters
The featured offer is not a ranking, it is the default. The other sellers sit behind a link most shoppers never open, and on mobile they are not on screen at all. So when someone else holds the box on your listing, the page still converts — for them, on your product, at a price you did not set.
What a lost box actually costsThe size of the prize
10–30%+
revenue our clients can recover
Every buy box lost to an unauthorised seller is a sale made at a price you did not set, on a listing you paid to build. Recovering those listings, closing the coverage gaps and holding distributors to their terms is where the range above comes from.
See what one scan cycle foundIndicative range. What Merqi recovers for your catalogue depends on how many of your listings are contested and how far price has drifted — the first report tells you which.
How it works
Every finding starts as a row in the same scan. What changes is the question you bring to it.
Platform shown through the H.Koenig account, with H.Koenig's permission, for data demonstration purposes.
What you get
The first two are what most brands come for. The rest is what they did not know they were missing — and the platform they read it all in.
See everything the platform reads{{ c.body }}
{{ c.detail }}
{{ c.body }}
{{ c.detail }}
On one client account, Merqi reads 4,196 listings across 78 active retailers every day and names every seller holding a box that should have been theirs. Catalogues are unlimited — this is one brand’s shelf, not our ceiling.
July 2026 monitoring cycle, as of 31 July. Platform shown through the H.Koenig account, with H.Koenig's permission, for data demonstration purposes.
Case study and research
One client's ledger, and the two questions every brand asks once they have seen it.
Platform shown through the H.Koenig account, with H.Koenig's permission, for data demonstration purposes.
Go deeper
The latest intel on how buy boxes are set, new legislation across the jurisdictions we cover, how to enforce MAP legally, and breakdowns on dealing with rogue sellers — and how to approach each of them using the right ecommerce intelligence.
We’ll use your details to respond to this request. See our Privacy Notice.
{{ page.eyebrow }}
{{ page.sub }}
{{ page.clientCaption }}
{{ page.eyebrow }}
{{ page.sub }}
Platform shown through a client account, with permission, for data demonstration purposes.
{{ art.eyebrow }}
{{ art.sub }}
{{ art.pageNote }}
{{ art.byline }}
{{ art.bylineRole }}
{{ art.disclaimer }}
{{ art.standfirst }}
{{ p.text }}
{{ p.text }}
{{ p.text }}
| {{ col }} |
|---|
| {{ cell.v }} |
{{ r }}
Legal
{{ legalDoc.version }}
{{ rn.t }}
| {{ hd }} |
|---|
| {{ cl.v }} |
{{ rn.t }}
| {{ hd }} |
|---|
| {{ cl.v }} |
{{ legalDoc.lastUpdated }} {{ legalDoc.foot }}
{{ b.eyebrow }}
{{ b.lede }}
{{ c.body }}
{{ c.detail }}
{{ c.body }}
{{ c.detail }}
Platform shown through the H.Koenig account, with H.Koenig's permission, for data demonstration purposes.
{{ b.eyebrow }}
{{ b.lede }}
Platform shown through the H.Koenig account, with H.Koenig's permission, for data demonstration purposes.
{{ b.eyebrow }}
{{ b.lede }}
{{ v.body }}
Hover a panel to play its recording. Platform shown through the H.Koenig account, with H.Koenig's permission, for data demonstration purposes.
{{ b.eyebrow }}
{{ b.lede }}
{{ b.eyebrow }}
{{ b.lede }}
{{ b.eyebrow }}
{{ s.body }}
{{ b.eyebrow }}
{{ b.lede }}
{{ p }}
{{ s.pull }}
{{ b.note }}
{{ b.eyebrow }}
{{ b.lede }}
| {{ c }} |
|---|
| {{ cell.v }} |
{{ b.note }}
{{ b.eyebrow }}
{{ b.lede }}
| {{ c }} | |||||
|---|---|---|---|---|---|
| {{ r.retailer }} | {{ r.market }} | {{ r.categories }} | {{ r.buybox }} | {{ r.refresh }} | {{ r.added }} |
{{ b.note }}
{{ b.eyebrow }}
{{ b.lede }}
{{ b.eyebrow }}
{{ b.lede }}
{{ b.note }}
Platform shown through the H.Koenig account, with H.Koenig's permission, for data demonstration purposes.
{{ b.eyebrow }}
{{ b.lede }}
{{ b.note }}
Platform shown through the H.Koenig account, with H.Koenig's permission, for data demonstration purposes.
{{ b.eyebrow }}
{{ b.lede }}
{{ p.body }}
{{ b.note }}
{{ b.eyebrow }}
{{ b.lede }}
{{ s.value }}
{{ s.label }}
{{ s.sub }}
{{ b.note }}
{{ b.eyebrow }}
{{ b.lede }}
A workbook is generated at the end of each scan cycle. The first one appears here once your first scan completes.
Get a free audit of your listings{{ exportSheet.footnote }}
{{ b.note }}
{{ b.eyebrow }}
{{ b.lede }}
{{ b.aside }}
{{ b.eyebrow }}
Page not found
The link may be old, or we may have moved it. Nothing is broken on your side.
{{ b.eyebrow }}
Buy-box hold rate
Alerts by kind, by week
{{ b.note }}